Reliability Tests
We present the testing results to show VeriFinger 13.1 template matching algorithm reliability on the data from different fingerprint readers.
| Flat fingerprint image datasets used for VeriFinger 13.1 algorithm testing | |||||
|---|---|---|---|---|---|
| Experiment 1 | Experiment 2 | Experiment 3 | |||
| Fingerprint reader model | DigitalPersona U.are.U 5100 |
Futronic FS80 | Cross Match Verifier 300 LC 2.0 |
||
| Image count | 11900 | 8600 | 10400 | ||
| Subject count | 73 | 43 | 67 | ||
| Unique finger count | 730 | 430 | 670 | ||
| Session count | 10 - 20 | 20 | 10 - 20 | ||
| Image size (pixels) | 252 x 324 | 320 x 480 | 640 x 480 | ||
Two tests were performed during each experiment:
- Test 1 maximized extraction and matching accuracy. VeriFinger 13.1 algorithm reliability in this test is shown as blue curves on the ROC charts.
- Test 2 maximized extraction and matching speed. VeriFinger 13.1 algorithm reliability in this test is shown as red curves on the ROC charts.
Receiver operation characteristic (ROC) curves are usually used to demonstrate the recognition quality of an algorithm. ROC curves show the dependence of false rejection rate (FRR) on the false acceptance rate (FAR).
Experiment 1
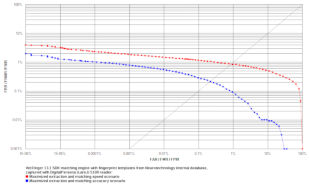
Click to zoom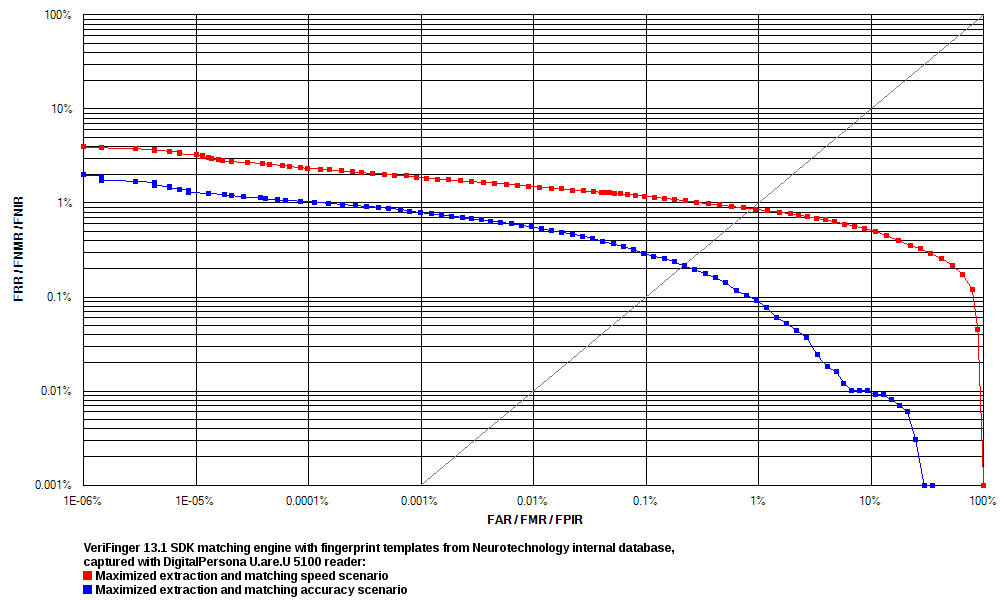
Click to zoom
Experiment 2
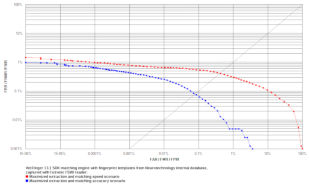
Click to zoom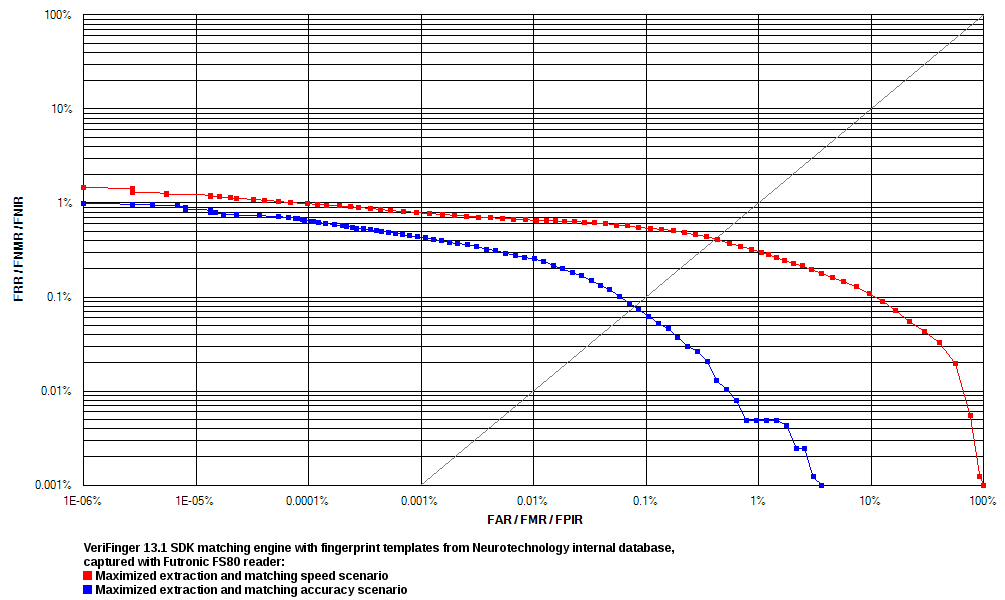
Click to zoom
Experiment 3
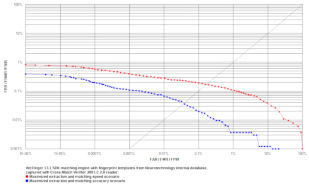
Click to zoom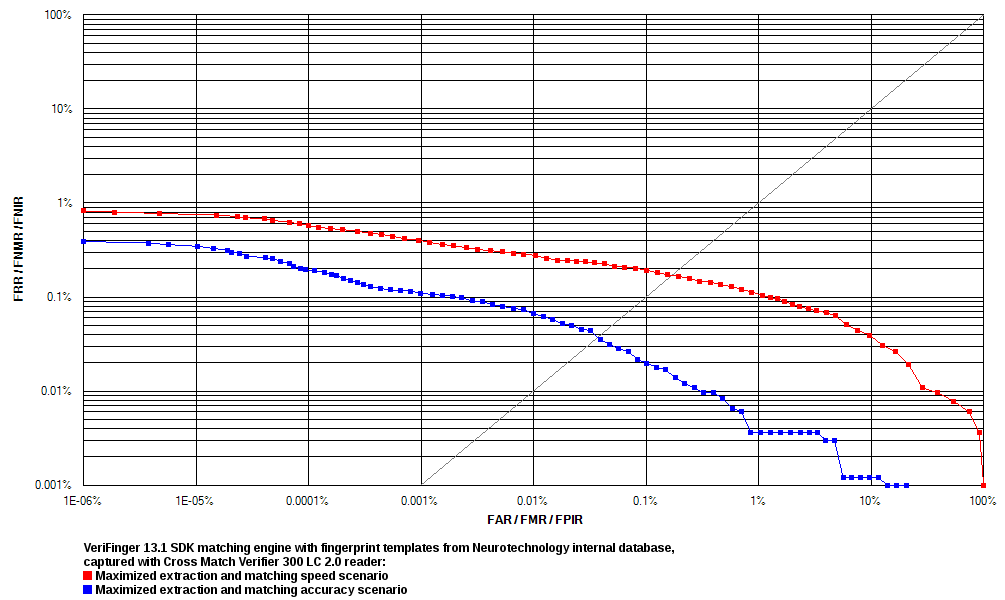
Click to zoom
| VeriFinger 13.1 algorithm reliability tests | ||||||
|---|---|---|---|---|---|---|
| Experiment 1 | Experiment 2 | Experiment 3 | ||||
| Test 1 | Test 2 | Test 1 | Test 2 | Test 1 | Test 2 | |
| Average template size (bytes) | 1740 | 318 | 2490 | 444 | 2439 | 442 |
| EER | 0.2070 % | 0.8102 % | 0.0786 % | 0.3930 % | 0.0379 % | 0.1646 % |
| FRR at 0.1 % FAR | 0.2906 % | 1.1810 % | 0.0734 % | 0.5490 % | 0.0216 % | 0.2028 % |
| FRR at 0.01 % FAR | 0.5565 % | 1.5010 % | 0.2632 % | 0.6628 % | 0.0732 % | 0.2849 % |
| FRR at 0.001 % FAR | 0.7906 % | 1.8870 % | 0.4370 % | 0.7913 % | 0.1092 % | 0.4031 % |